Tabulize (Visual-Insights)
Fully Automated & Interactive Insights Platform
Start your journey with Visual-Insights Tabulize – where insights are just a click away


Making Tabulization Simple and Efficient
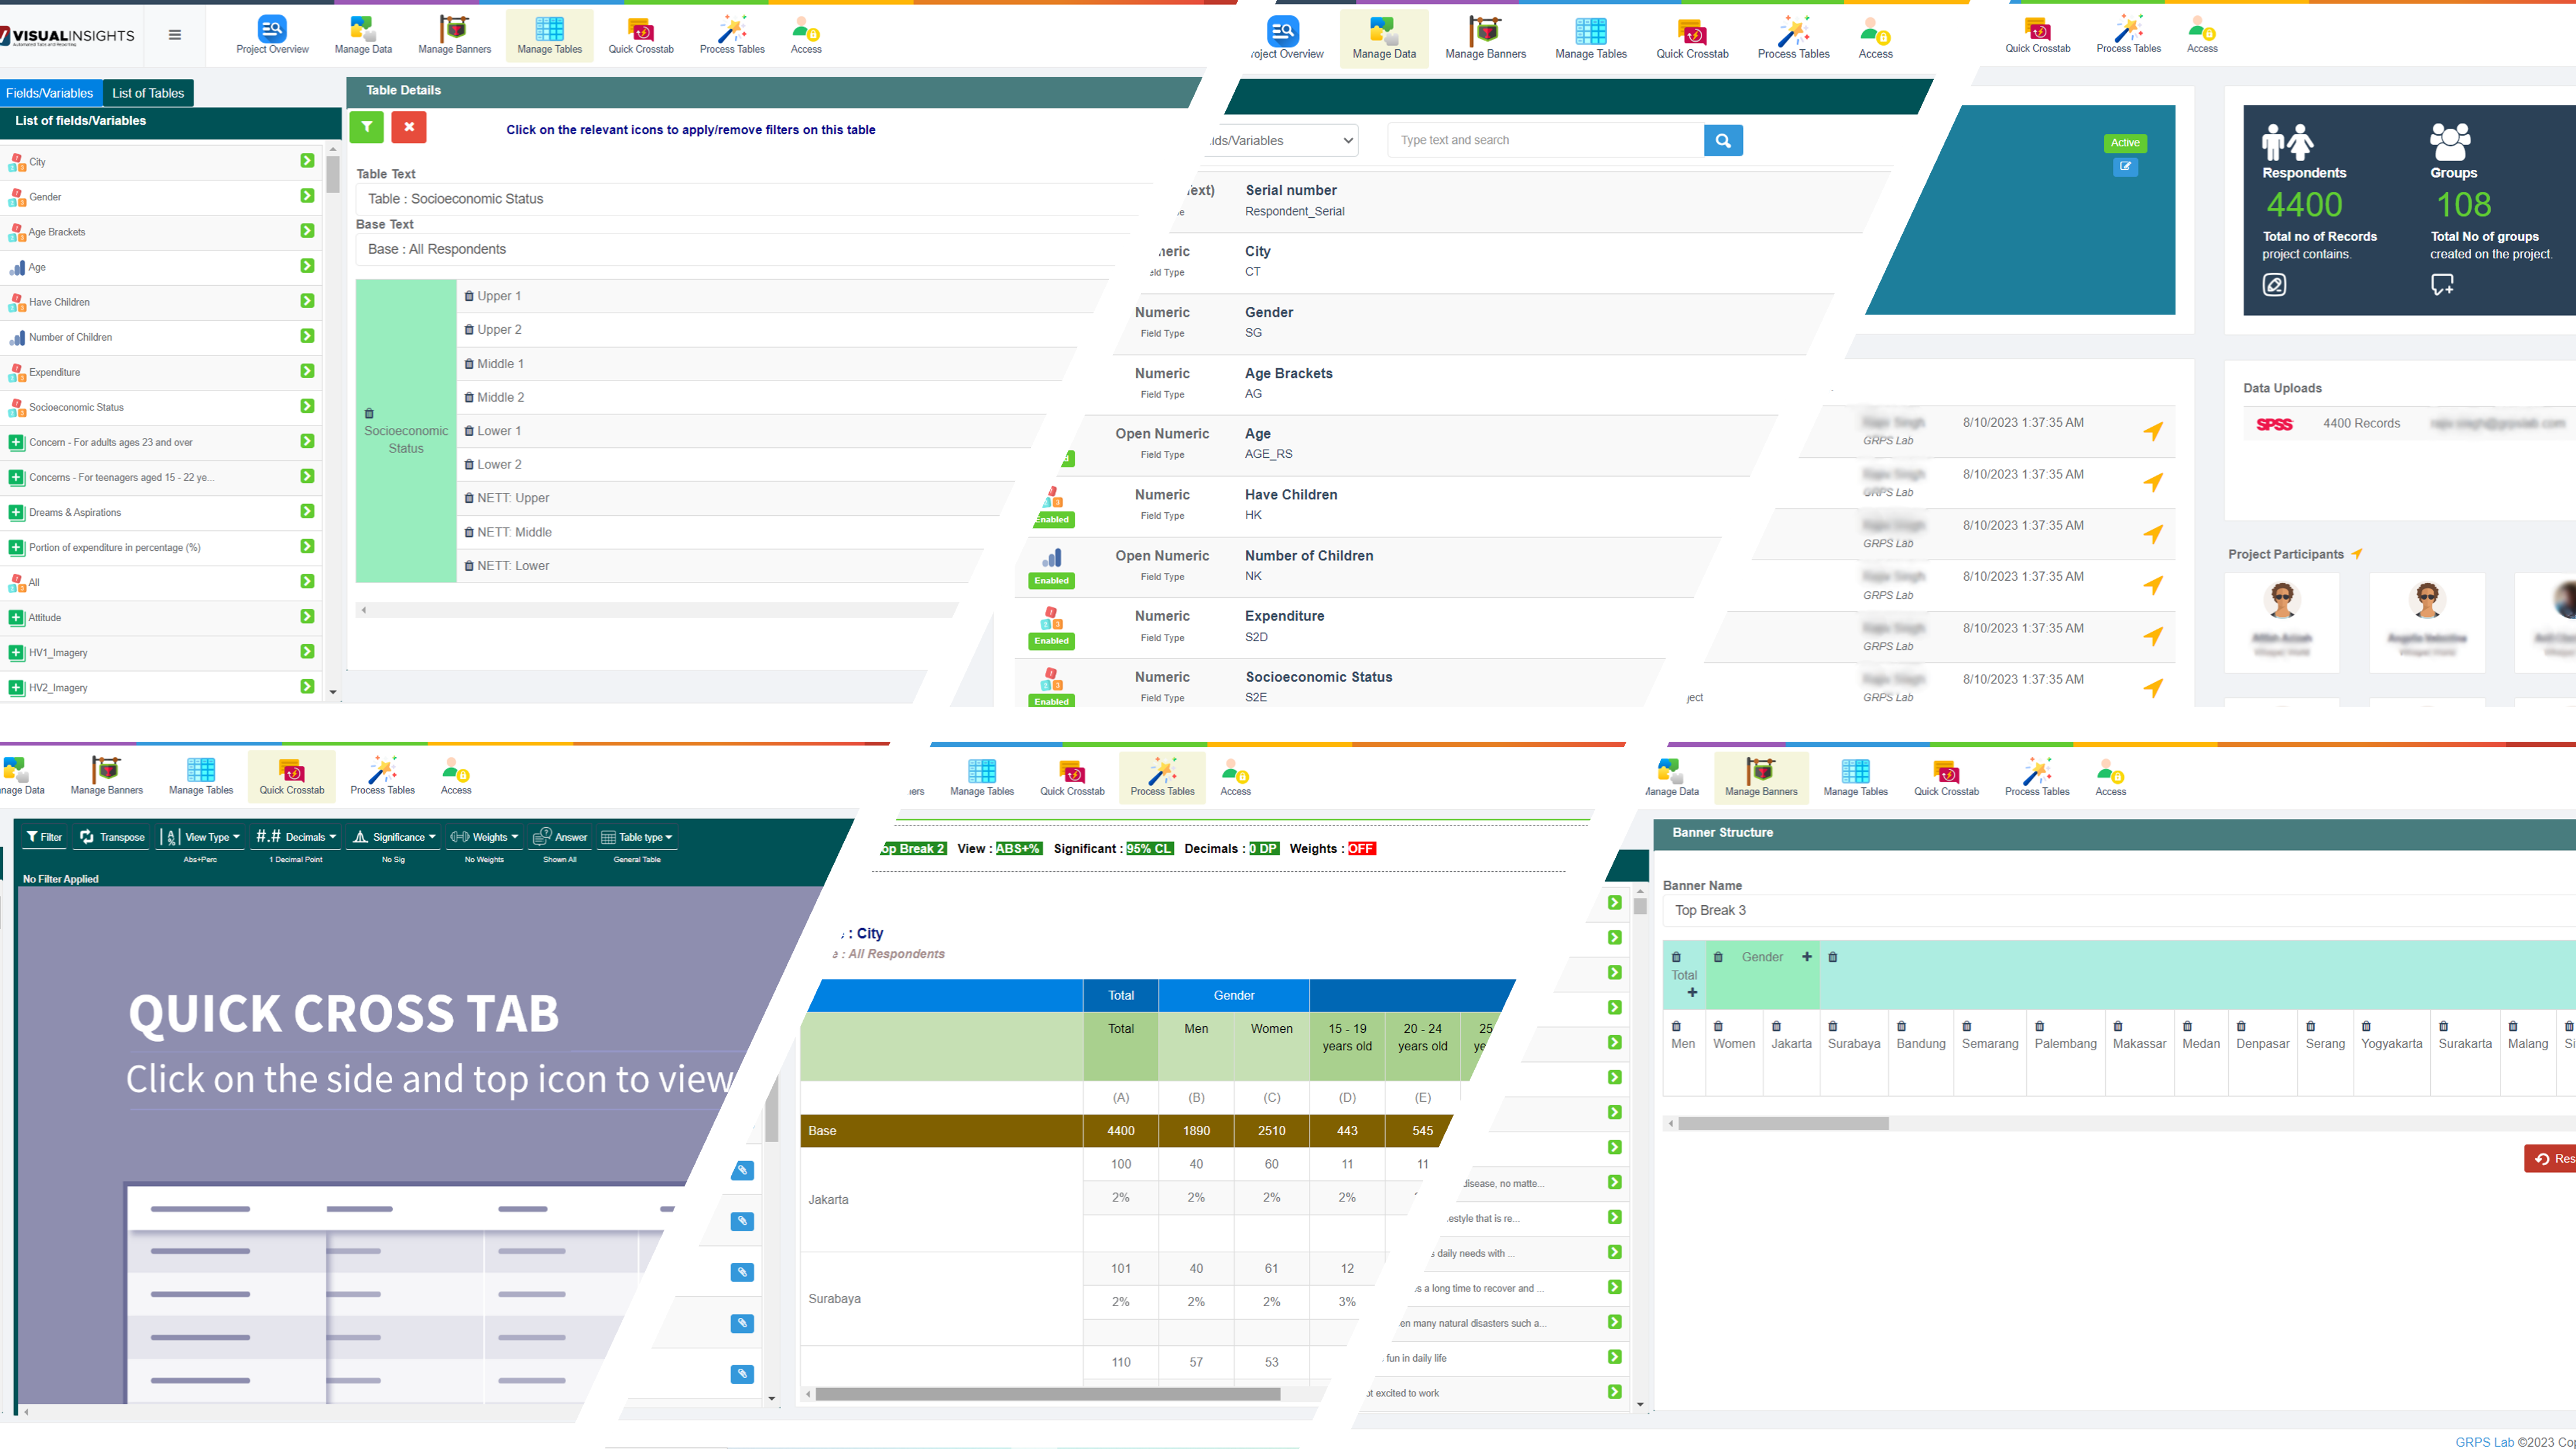
Visual-Insights Tabulize is more than just a cross-tabulation tool; it's a solution designed to streamline the entire process of data analysis & processing.
It's your partner in making data-informed decisions faster, providing you with the agility to adapt to market changes and maintain a competitive edge. With Visual-Insights Tabulize, you can focus more on strategy and less on the complexities of data handling. Its features include:
It's your partner in making data-informed decisions faster, providing you with the agility to adapt to market changes and maintain a competitive edge. With Visual-Insights Tabulize, you can focus more on strategy and less on the complexities of data handling. Its features include:
Reduced human intervention leading to fewer errors.
Significantly shorter research timelines and lower costs.
Precise and reliable data outputs with customizations.
Instant access to your analysis & data tables.
User Flow: Get Analysis & Insights in 4 Simple Steps:
1
Data Upload
Begin by uploading your data to the platform.
2
Customize Data Layout
Change variable or value labels, Group questions in various sections, add nettings, create custom filters, assign factors, add groupings, add ranges/breaks etc..
3
Define tables & top-breaks and customized sets for mass export.
Customize data tables, create top breaks & save them in different data table sets for monthly exports.
3
Download Tables
Obtain your analysis & tables in the well formatted tables, ready to be used for further analysis & reporting.

Versatility for Every Need
Visual-Insights Tabulize is adaptable to various requirements, offering both Adhoc and Recurring Projects.

Recurring Projects
(Templated Solutions / Disticks/ Trackers)
Create a new project and fill in relevant details.
Modify data labels, manage data, and create nettings.
Update analytical attributes as required.

Adhoc Projects
(AdHoc Studies)
Create a new project and fill in relevant details.
Upload data files & cross-tab variables
Update analytical attributes, generate tables and export to Excel for further use.
Get Started with Visual-Insights Tabulize
Ready to transform your data analysis & tabulation process? Visual-Insights Tabulize is here to elevate your analytical capabilities and streamline your decision-making process. Don't let complex data and time-consuming manual data analysis & processing slow down your progress.
Instead, embrace the power of automation and accuracy with our cutting-edge solution.
Take the first step towards smarter tabulation:
Contact Us
Reach out to our team of experts to discuss your unique needs and how Visual-Insights Tabulize can cater to them. We're here to guide you through every step and ensure a seamless transition to automated analysis & cross-tabulation.
Request a Demo
See Visual-Insights Tabulize in action. Schedule a demo to witness firsthand how our platform can simplify your analysis & cross-tabulation process, save valuable time, and provide the insights you need to make informed decisions.
Explore Custom Options
Every business is unique, and so are your cross-tabulation needs. Talk to us about customizing Visual-Insights Tabulize to fit your specific requirements, whether it's for adhoc, recurring projects, or something entirely bespoke.

